
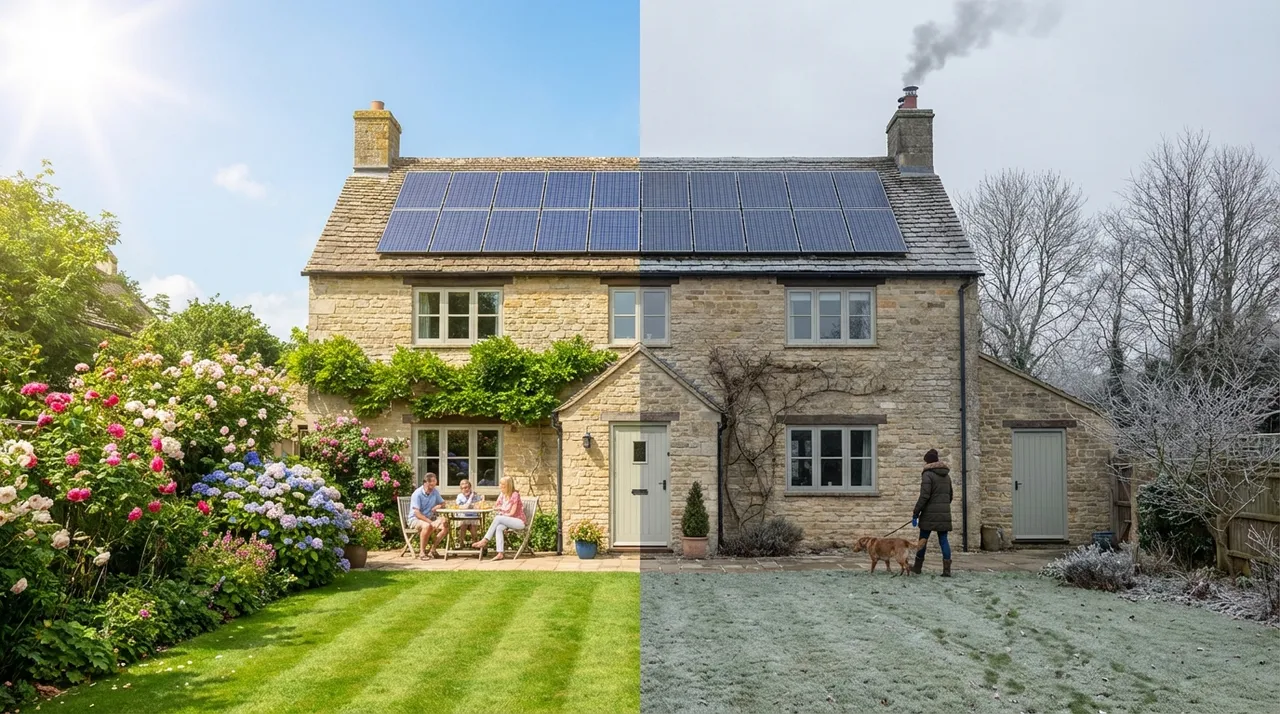
A 4kW solar system in southern England generates about 20-35 kWh in December and 140-175 kWh in June, and 3,400 to 4,200 kWh across a full year. The table below shows the monthly figures for 3kW to 6kW systems.
| Month | 3kW | 4kW | 5kW | 6kW | 4kW per day |
|---|---|---|---|---|---|
| January | 19-30 kWh | 25-40 kWh | 31-50 kWh | 38-60 kWh | 0.8-1.3 kWh |
| February | 30-45 kWh | 40-60 kWh | 50-75 kWh | 60-90 kWh | 1.3-2.0 kWh |
| March | 60-82 kWh | 80-110 kWh | 100-138 kWh | 120-165 kWh | 2.6-3.5 kWh |
| April | 82-105 kWh | 110-140 kWh | 138-175 kWh | 165-210 kWh | 3.6-4.5 kWh |
| May | 98-120 kWh | 130-160 kWh | 162-200 kWh | 195-240 kWh | 4.2-5.2 kWh |
| June | 105-131 kWh | 140-175 kWh | 175-219 kWh | 210-262 kWh | 4.6-5.6 kWh |
| July | 101-128 kWh | 135-170 kWh | 169-212 kWh | 202-255 kWh | 4.4-5.5 kWh |
| August | 90-116 kWh | 120-155 kWh | 150-194 kWh | 180-232 kWh | 3.9-5.0 kWh |
| September | 68-90 kWh | 90-120 kWh | 112-150 kWh | 135-180 kWh | 3.0-4.0 kWh |
| October | 41-60 kWh | 55-80 kWh | 69-100 kWh | 82-120 kWh | 1.8-2.6 kWh |
| November | 22-38 kWh | 30-50 kWh | 38-62 kWh | 45-75 kWh | 1.0-1.6 kWh |
| December | 15-26 kWh | 20-35 kWh | 25-44 kWh | 30-52 kWh | 0.7-1.1 kWh |
If you're thinking about going solar, one of the first questions you'll ask is: how much electricity will I actually get? The honest answer depends on your system size, your roof, and where you live, but we can give you solid real-world figures to work with.
This guide walks through solar panel output by day, by month, and by square metre, explains the factors that affect generation, and shows you how to estimate savings for your own home.
Want to skip straight to the numbers? Use our Solar Savings Calculator to get a personalised estimate for your property, or get an instant price for your home with our solar panel cost calculator.
For more detail, see how much energy solar panels produce per day, how much electricity a 4kW system produces and whether solar panels work in cloudy weather. Roof direction and tilt matter too: read about the optimum angle for solar panels, whether solar panels need to face south and how many solar panels you need.
How Do I Calculate a Solar Panel's Output?
The basic formula is straightforward:
Output (kWh) = System capacity (kW) × Peak sun hours × Panel efficiency
This formula helps you estimate the annual generation of a solar PV system, which is the total amount of electricity produced over a year. Annual generation varies depending on system size, orientation, and geographic location.
In practice, a standard 4kW solar panel system in the UK generates around 3,400 to 4,200 kWh of electricity per year under real-world conditions. That's enough to cover a significant portion of a typical household's annual electricity demand. The annual output is a key metric for estimating your system's overall energy production and its impact on your energy bills.
1. Solar Panel Output Per Day
Daily output varies considerably depending on the season. A 4kW system in the UK will typically produce:
- Summer (June-August): 14-18 kWh per day
- Spring/Autumn (March-May, September-October): 9-14 kWh per day
- Winter (November-February): 1-5 kWh per day
Example: A 4kW south-facing system in Hampshire generates around 16 kWh on a clear June day, enough to run a washing machine, dishwasher, fridge, TV, and a full evening of lighting without touching the grid.
Knowing how many kWh your system produces per day is essential for estimating potential savings and understanding your daily solar electricity generation.
2. Solar Panel Output Per Month
Output typically breaks down across the year like this for a system installed in southern England:
The table at the top of this page has the monthly figures for 3kW to 6kW systems, including the 4kW output per day.
These figures are based on average irradiation data for southern England. Homes further north will see lower figures, particularly in winter. Homes on the south coast, like those we install across Hampshire, tend to sit at the higher end of these ranges. The typical output shown here reflects the average monthly and annual production you can expect under standard conditions.
3. Solar Panel Output Per Square Metre
Most panels on the UK market produce between 150W and 400W per panel and take up roughly 1.6-2.0 square metres of roof space each.
For a rough estimate of what your roof can accommodate:
Formula: Number of panels × Panel wattage = Total system capacity (W)
Example: 14 panels × 300W = 4,200W (4.2kW system). At 2m² per panel, that uses 28m² of roof space and generates around 3,800-4,200 kWh per year in southern England.
A typical semi-detached home with a clear south-facing roof can usually fit 10-16 panels depending on roof size and layout. How many panels you can install directly affects your total system output and the amount of solar electricity you can generate, so optimising roof space is important.
How Many Watts Does a Solar Panel Produce?
A single solar panel in the UK currently produces between 250W and 420W under peak conditions (direct midday sun, optimal angle, no shading). Most panels installed today fall in the 350-400W range.
Under real UK conditions, accounting for cloud cover, seasonal variation, and the angle of the sun, a 400W panel will produce roughly:
- 1.0-1.4 kWh per day averaged across the year
- Around 350-450 kWh per year
That's one solar panel. To estimate the output of one solar panel, consider its wattage, efficiency, and the amount of sunlight it receives at your location.
A system of 12-16 panels scales that up to 4,000-7,000 kWh annually.
Solar panel yields can differ significantly in other countries due to variations in solar irradiance and climate, so UK figures may not match those in sunnier regions.
How Much Electricity Does a 1kW Solar Panel System Produce?
A 1kW system in the UK generates approximately 850-1,000 kWh per year, depending on location and roof orientation. Most homes don't install systems this small, a 1kW system would only cover a fraction of a typical household's energy use, but the figure is a useful baseline for scaling up.
- 2kW system: 1,700-2,000 kWh/year
- 3kW system: 2,550-3,000 kWh/year
- 4kW system: 3,400-4,000 kWh/year
- 5kW system: 4,250-5,000 kWh/year
- 6kW system: 5,100-6,000 kWh/year
The maximum amount of electricity a solar system can produce is its rated capacity under ideal conditions, but real-world performance is usually lower due to weather and seasonal factors. More sunshine during the summer months means higher output, while in the winter months, output can drop significantly, sometimes to only 25%-35% of annual electricity due to shorter days and lower sun angles.
How Effective Are Solar Panels?
Several factors influence how much electricity your panels actually produce. Here's what matters and why:
| Factor | What it means for your output |
|---|---|
| System capacity | A 4kW system produces roughly twice as much as a 2kW system. Most UK homes install between 3kW and 6kW. A 4kW solar system can save up to £700-£900 per year on electricity bills. |
| Panel efficiency | Standard panels convert around 15-20% of sunlight into electricity. Premium panels push closer to 22-23%. |
| Panel material | Monocrystalline panels are the most efficient and perform better in low light. Polycrystalline panels cost less but produce slightly less per panel. |
| Roof direction | South-facing roofs generate the most electricity year-round. East or west-facing roofs produce around 15-20% less. North-facing roofs are not recommended. |
| Roof angle | The ideal pitch in the UK is between 30° and 40°. A south-facing roof at a 35-40 degree tilt is optimal for maximising solar generation. Flat roofs can use angled mounting frames to compensate. |
| Shade | Even partial shading from a chimney, tree, or neighbouring building can significantly reduce output. Using microinverters can help mitigate the effects of shading. A shading analysis before installation is always worthwhile. |
| Your location | The south coast of England receives around 60% more peak sun hours per year than northern Scotland. A home in Hampshire will consistently outperform the same system installed in the Highlands. |
Can I Store the Electricity My Panels Generate?
Solar panels generate electricity during daylight hours, but household demand peaks in the morning and evening. Without storage, surplus daytime generation gets exported to the grid, usually at a lower rate than you'd pay to import it back.
A battery storage system solves this. It captures excess generation during the day and releases it when you need it most, typically cutting grid imports by an additional 30-50% on top of what panels alone deliver.
The results from our customers show just how much of a difference battery storage makes:
- One Hampshire home with solar panels and a battery had a net gas and electricity cost of £316.43 over 12 months, after export payments
- The homeowner estimates that after about £260 of standing charges, energy alone costs about £4.66 a month
Panels and batteries work especially well when combined with a smart tariff, which lets you top up the battery overnight at low off-peak rates (as low as 7p/kWh) to cover any gap the solar doesn't fill. See our real customer savings case studies for verified before-and-after figures.
How Do I Check That My Solar Panels Are Working Efficiently?
Most modern solar installations include a monitoring app or online portal that shows you real-time and historical generation data. With a system like SolarEdge, which we install across many of our Hampshire projects, you can see output at the individual panel level, making it easy to spot if any single panel is underperforming.
Signs that your system may not be working at full efficiency:
- Generation is consistently lower than expected for the time of year
- Output from one or more panels is significantly lower than the others
- The inverter is showing a fault light or error code
- Your electricity bills haven't reduced as expected
CRG Direct offers ongoing maintenance and aftercare for all installations. If something doesn't look right, get in touch and we'll check it out.
Find Out What Your Roof Could Generate
Every home is different. The best way to get an accurate output estimate is to have your roof assessed by an MCS Certified installer who can account for your specific orientation, shading, and energy usage.
Use our Solar Savings Calculator to get a personalised estimate, or call us on +44 330 133 2497 to speak to our team directly.
CRG Direct are MCS Certified solar and renewable energy specialists serving Hampshire, Portsmouth, Southampton, and the wider South and South East of England.
Related questions
- How much energy does a solar panel produce per day?
- How much electricity does a 4kW solar system produce?
- Do solar panels work in cloudy weather?
- What is the optimum angle for solar panels?
- Do solar panels need to face south?
- How many solar panels do I need?
- How many solar panels does a 3-bedroom house need?
- Solar panel sizes and roof space