
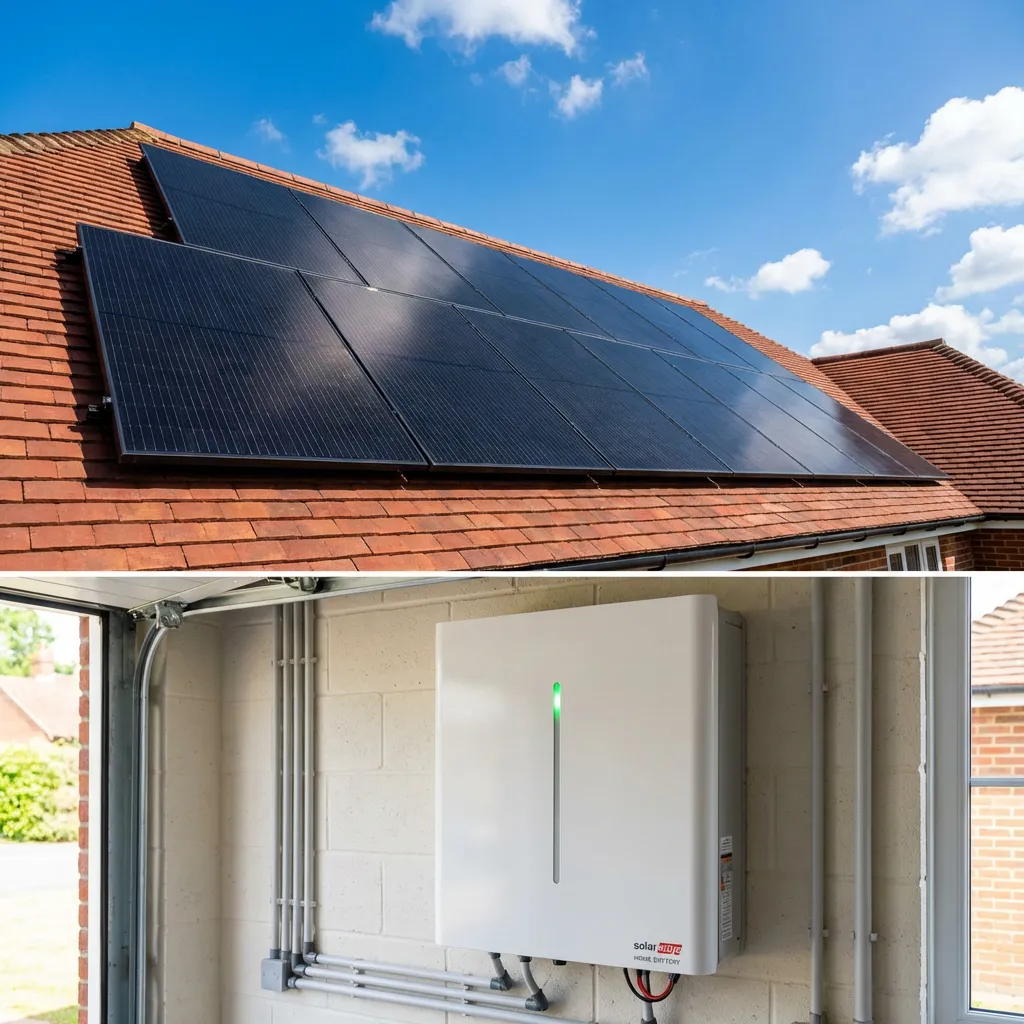
How Much Can Solar Panels Actually Save You on Your Energy Bill? Real Customer Results
Real customer data showing an 85% reduction in energy bills, from £178 to £25 per month, with actual energy consumption costs of just £4.66 per month.
Hampshire • Residential
lower gas and electricity bill
85%
net cost over 12 months
£316.43
a month for energy alone, after standing charges
£4.66
The savings and payback figures in this case study are this customer's actual results. Your own savings will be specific to your installation and depend on your energy generation and usage, and on energy costs at the time of installation.
" I can report the solar installation is working very well indeed. My bills for energy alone are £56 per year or £4.66 per month! "
Property Details
- Property Type
- Residential
- Location
- Hampshire
Services Installed
The Real Cost of Solar Panels: Before and After
Let's break down exactly how much this homeowner is saving with solar panels. These are real numbers from an actual UK household, not estimates or projections.
| Monthly | Annual | |
|---|---|---|
| Before Solar Panels Bill | £178 | £2,136 |
| After Solar Panels Bill | £25 | £316 |
| Total Savings | £153/month | £1,820/year |
Breaking Down the Numbers
The £316 annual cost includes standing charges for gas and electricity of approximately £260 per year. These are fixed fees you pay regardless of how much energy you use, essentially the cost of being connected to the grid.
Here's the remarkable part: After subtracting standing charges, this homeowner is paying just £56 per year for actual energy consumption. That works out to £4.66 per month.
Real Solar Panel Performance: Daily Energy Data
How do solar panels actually perform day-to-day? Here's real consumption data from January 2026, showing how this system handles winter conditions when solar generation is typically lower:
| Date | Grid Import | Gas | Solar Export | Total Usage | Daily Cost |
|---|---|---|---|---|---|
| Tue 13 Jan | 12.26 kWh | 91.41 kWh | 0.31 kWh | 103.37 kWh | £7.56 |
| Mon 12 Jan | 11.31 kWh | 79.13 kWh | 0.30 kWh | 90.14 kWh | £6.49 |
| Sun 11 Jan | 8.22 kWh | 126.69 kWh | 0.34 kWh | 134.58 kWh | £9.16 |
What Does This Mean for Solar Panel Savings?
This case study demonstrates that solar panels can deliver transformative savings on your energy bill:
- £56 a year for actual energy usage: After the £260 of standing charges, according to the homeowner's own figures
- £1,820 saved annually: Money that stays in your pocket year after year
- Modest grid imports: Only 8-12 kWh of electricity imported per day in January
- Consistent performance: These results are from January, traditionally one of the worst months for solar generation in the UK. Summer performance will be even better
The Bottom Line
The energy app shows a net cost of £316.43 for gas and electricity over the last 12 months, after export payments.
Key Statistics:
- Before solar: £2,136 per year
- After solar: £316 per year
- Annual savings: £1,820 (85% reduction)
- Energy consumption cost: £4.66 per month
- Grid electricity import: 8-12 kWh per day (winter)
Financial Summary
Previous Annual Bill
£2,136
Reduction
85%
New Annual Bill
£316
Annual Savings
£1,820
Related Case Studies
Ready to Start Saving?
See how much you could save with our personalized energy audit. Get a quote today.